Mid Exam Stats
This page contains analyses for the 2nd Quarter Mid Exam.
Individual Grade Viewer
Midterm 1 Tendecies:
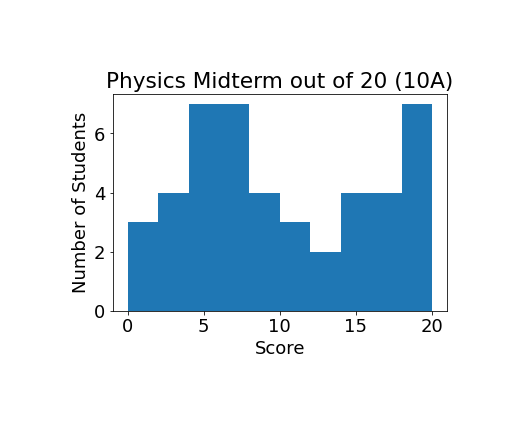
10 A
The average score out of 20, was 9.677777777777777 with the standard deviation being 6.068274105318904
10 A Grade Distribution
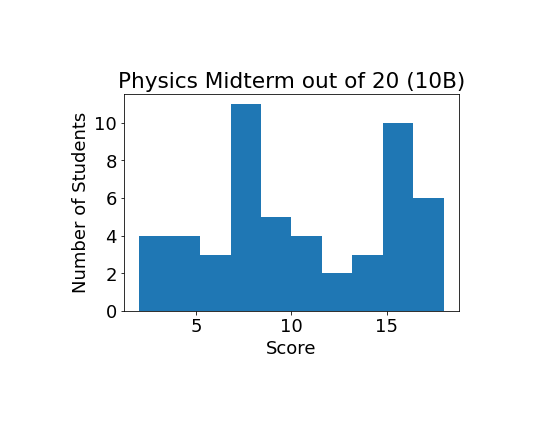
10 B
The average score out of 20, was 10.423076923076923 with the standard deviation being 4.650666428035026
10 B Grade Distribution
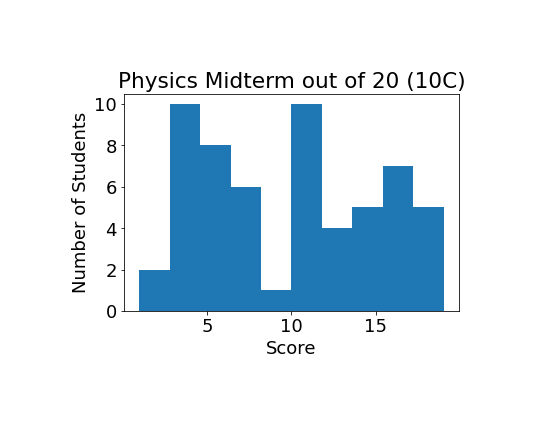
10 C
The average score out of 20, was 9.879310344827585 with the standard deviation being 5.157276701191396
10 C Grade Distribution
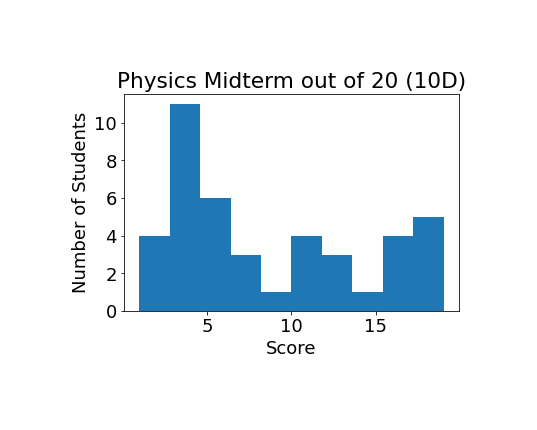
10 D
The average score out of 20, was 8.476190476190476 with the standard deviation being 5.782725075347448
10 D Grade Distribution
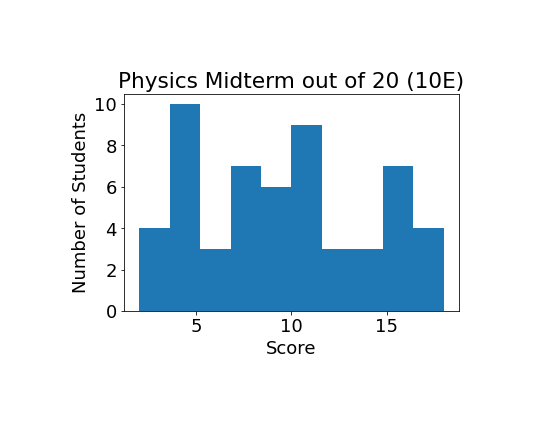
10 E
The average score out of 20, was 9.544642857142858 with the standard deviation being 4.490343593394017
10 E Grade Distribution